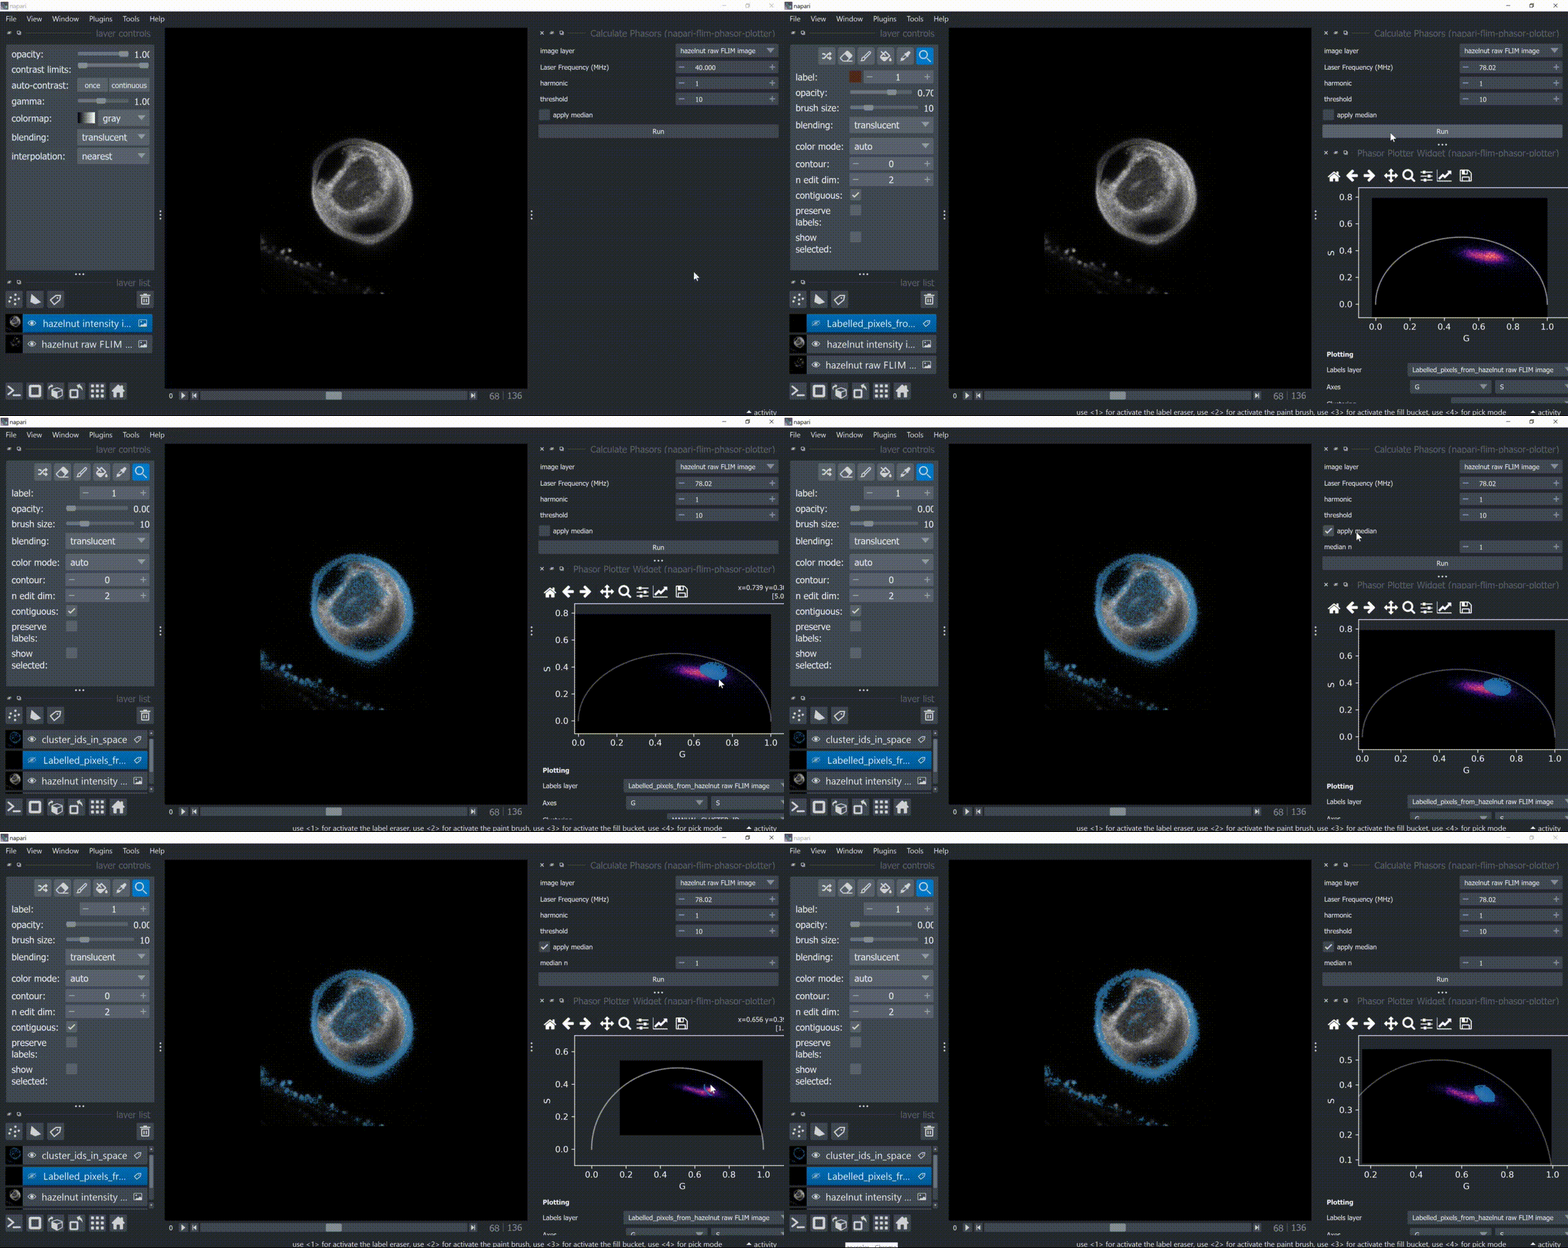
Segmenting an example FLIM image with the phasor plot in napari#
Open the hazelnut 2D, hazelnut 3D or the synthetic lifetime cat sample data from the napari-flim-phasor-plotter under
File > Open Sample > napari-flim-phasor-plotterCalculate the phasor plot under
Plugins > napari-flim-phasor-plotter > Calculate PhasorsManually select clusters with the mouse and check the segmentation results on the main canvas.
Re-calculate the phasor plot exploring other parameters (median, harmonic, threshold) to improve clusters display in the phasor plot.

